NIOS Class 12 Economics Chapter 10 – Correlation Analysis explains the statistical methods used to study the relationship between two variables. This chapter covers positive, negative and zero correlation, the correlation coefficient, Karl Pearson’s correlation method, Spearman’s rank correlation, covariance and scatter diagrams. Students will learn how to identify and measure the strength and direction of relationships between variables with the help of examples and numerical problems. In this article, NIOS Class 12 Economics Chapter 10 students will find complete textbook questions and answers, including intext questions, multiple-choice questions and terminal exercise solutions, explained in simple language to support their exam preparation.
NIOS Class 12 Economics Chapter – 10 Correlation Analysis
Module – IV Statistical Tools
TEXT-BOOK QUESTIONS WITH ANSWERS
INTEXT QUESTIONS 10.1
Q.1. It has been noted that there is a positive correlation between the I.Q. level and the size of women’s shoes. With smaller size of shoes of women corresponds to lower intelligence level and higher size of shoes of women corresponds to higher intelligence level of women. Comment on the conclusion that economic factors cause hemlines to rise the fall.
Ans. IQ level and the size of women’s shoes may have positive relation, yet the economic factors will have positive relation with the women’s IQ level. Better economy and better facilities and infrastructure means better IQ. And per facilities and infrastructure means lower IQ.
Q.2. A researcher has a large number of data pairs. (age, height) of humans beings from birth to 70 years. He computes a correlation coefficient. Would you expect it to be positive or negative? Why?
Ans. Correlation of age and height will be positive. This is because when the age increase the height also increases and it may happen until the age of 25. After that the height will not increase and remain the same with the increase in age. So it will positive correlation.
INTEXT QUESTIONS 10.2
Q.1. What sort of correlation would be expected between a company’s expenditure on health and safety and the number of work related accidents.
(a) Positive.
(b) Negative.
(c) None.
(d) Infinite.
Ans. (b) negative.
Q.2. When “r” is negative, one variable increase in value, ……..
(a) The other increases.
(b) The other increases at a greater rate.
(c) The other variable decreases in value.
(d) There is no change in the other variable.
(e) All of the above.
Ans. (c) The other variable decreases in value.
INTEXT QUESTIONS 10.3
Q.1. The coefficient of correlation ranges between:
(a) 0 and 1
(b) -1 and +1
(c) Minus infinite and plus infinity.
(d) 1 and 100.
Ans. (b) -1 and +1.
Q.2. If two variables are absolutely independent of each other the correlation between them must be:
(a) -1
(b) 0
(c) +1
(d) +0.1
Ans. (b) 0
Q.3. The coefficient of correlation:
(a) Can be larger than 1.
(b) Cannot be larger than 1.
(c) Cannot be negative.
Ans. (b) Cannot be larger than 1.
Q.4. If height is independent of average yearly income, what is the predicted correlation between these two variables?
(a) 1
(b) -1
(c) 0
(d) Impossible to say for sure.
Ans. (c) 0.
Q.5. A student produces a correlation of +1.3. This is:
(a) A high positive correlation.
(b) A significant correlation.
(c) An impossible correlation.
(d) Only possible if N is large.
Ans. (c) An impossible correlation.
Q.6. If A scored the top mark in the apprentices test on computing and the correlation between that test and the test on English language was +1.0 what position did A get in the test on English language?
(a) Middle.
(b) Bottom.
(c) Top.
(d) Cannot say from the information given.
Ans. (c) Top.
Q.7. Which correlation is the strongest +0.65 or -0.70?
(a) -0.70.
(b) +0.65
(c) Depends on N.
(d) Cannot say from the information given.
Ans. (a) -0.70.
Q.8. The symbol for the Karl Pearson Correlation Coefficient is:
(α) Σ
(b) σ
(c) a
(d) r
Ans. (d) r.
Q.9. For a normal good, if price increases then the quantity demanded decreases. What type of correlation co-efficient would you expect in this situation?
(a) 0
(b) positive.
(c) 0.9
(d) Negative.
(e) Unknowable.
Ans. (d) Negative.
INTEXT QUESTIONS 10.4
Q.1. Given a set of paired data (X, Y)
(a) If X is independent of X, then what value of a correlation coefficient would you expect?
Ans: The value of a correlation coefficient would be zero.
(b) If Y is linearly dependent on X, then what value of a correlation coefficient would you expect?
Ans. The value of a correlation coefficient would be either +1, -1 or between +1 and -1.
Q.2. State whether the following statement is true or false: “If opposite correlation exists between height and weight, a person with above average height is expected to have above average weight”.
Ans. It is true if a positive correlation exists between height and weight, a person with above average height is expected to have above average weight. This is so because in positive correlation two variable change in the same directions and in the same proportion.
INTEXT QUESTIONS 10.5
Q.1. Positive values of covariance indicate
(a) A positive variance of the X values.
(b) A positive variance of the Y values.
(c) The standard deviation is positive.
(d) Positive relation between two variables.
Ans. (d) Positive relation between two variables.
INTEXT QUESTIONS 10.6
Q. 1. The marks awarded by two judges in a certain beauty contest are given below:

By using rank correlation method, determine whether the two judges have common taste in the judgement of beauty?
Ans. Rank = 1 – 6ΣD² / N(N² – 1)
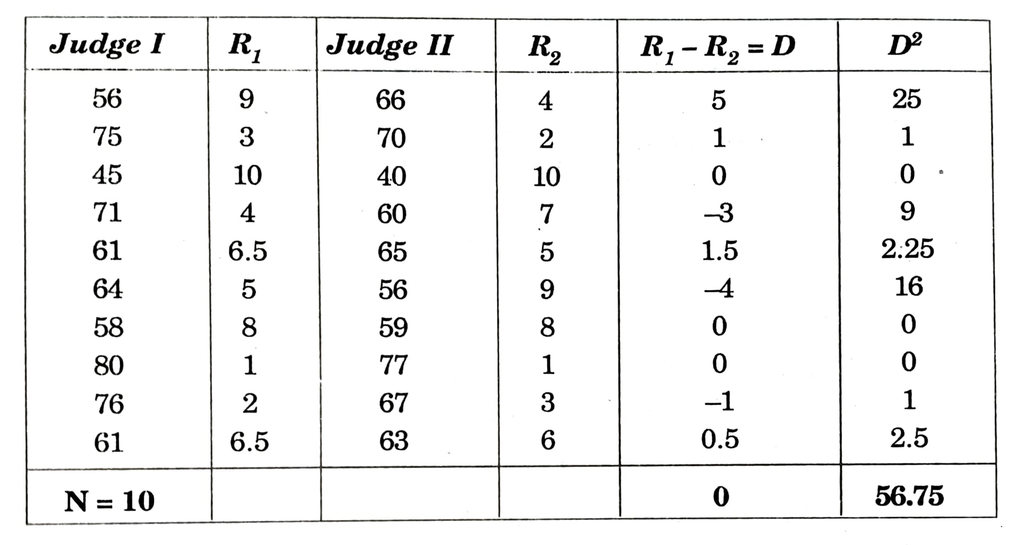
R = 1 – 6ΣD²/N(N² – 1)
= 1 – 6 x 56.75 / 10 (10² – 1) = 1 – 340.5/990
= 1 – 0.34 = 0.66
The two judges have positive correlation.
TERMINAL EXERCISE
Q.1. The data relating to variable X and Y is given below:

(a) Sketch a scatter plot.
(b) Compute the correlation coefficient, r.
Ans. (a)

(b)


It is a negative correlation.
Q.2. Calculate and analyze the correlation coefficient between the number of study hours and the number of sleeping hours of different students.
| Number of Study hours | 2 | 4 | 6 | 8 | 10 |
| Number of sleeping hours | 10 | 9 | 8 | 7 | 6 |
Ans.
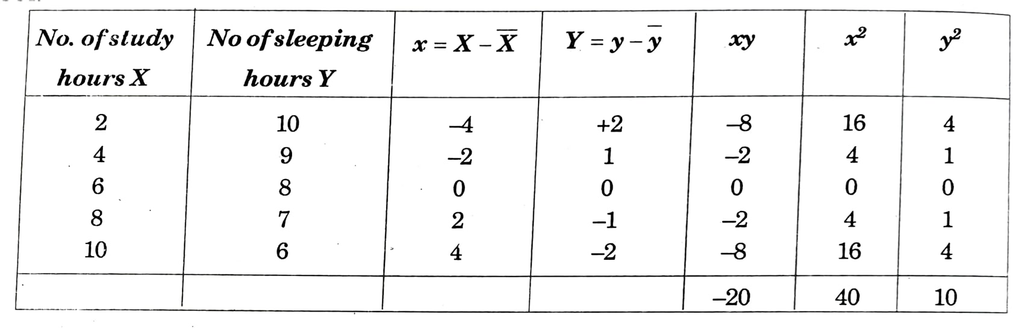
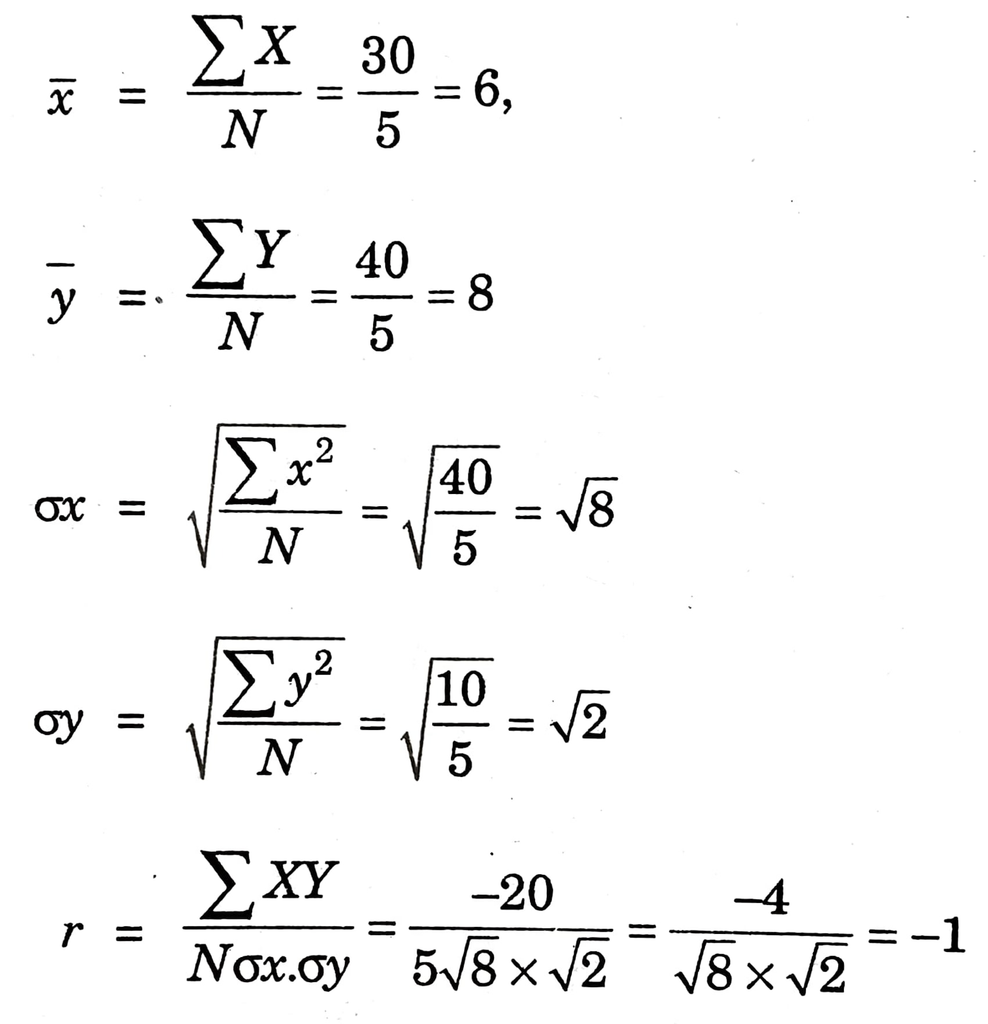
Study hrs and sleeping hrs have perfect negative correlation.
Q.3. Find the value of the correlation coefficient from the following table:
| Subject | Age X | Glucose Level Y |
| 1 | 43 | 99 |
| 2 | 21 | 65 |
| 3 | 25 | 79 |
| 4 | 42 | 75 |
| 5 | 57 | 87 |
| 6 | 59 | 81 |
Ans.


The value of r = 0.08 shows very low positive correlation between age and glucose levels.
Q.4. The values of the same 15 students in two subjects A and B are given below; the two numbers within the brackets denoting the ranks of the same student in A and B respectively.

Use Spearman’s formula to find the rank correlation coefficient.
Ans.


Q.5. Calculate Karl Pearson’s coefficient of correlation from the advertisement cost and sales as per the data given below:

Ans.


The correlation is positive and moderate.
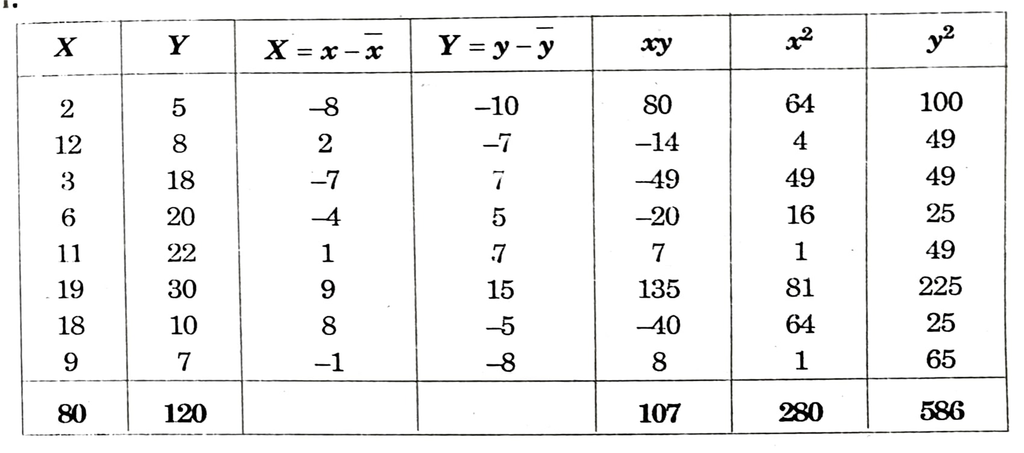
Q.6. The following observations are given for two variables:
| Y | X |
| 5 | 2 |
| 8 | 12 |
| 18 | 3 |
| 20 | 6 |
| 22 | 11 |
| 30 | 19 |
| 10 | 18 |
| 7 | 9 |
(a) Compute and interpret the sample covariance for the above data.
(b) Compute and interpret the sample correlation coefficient.
Ans.

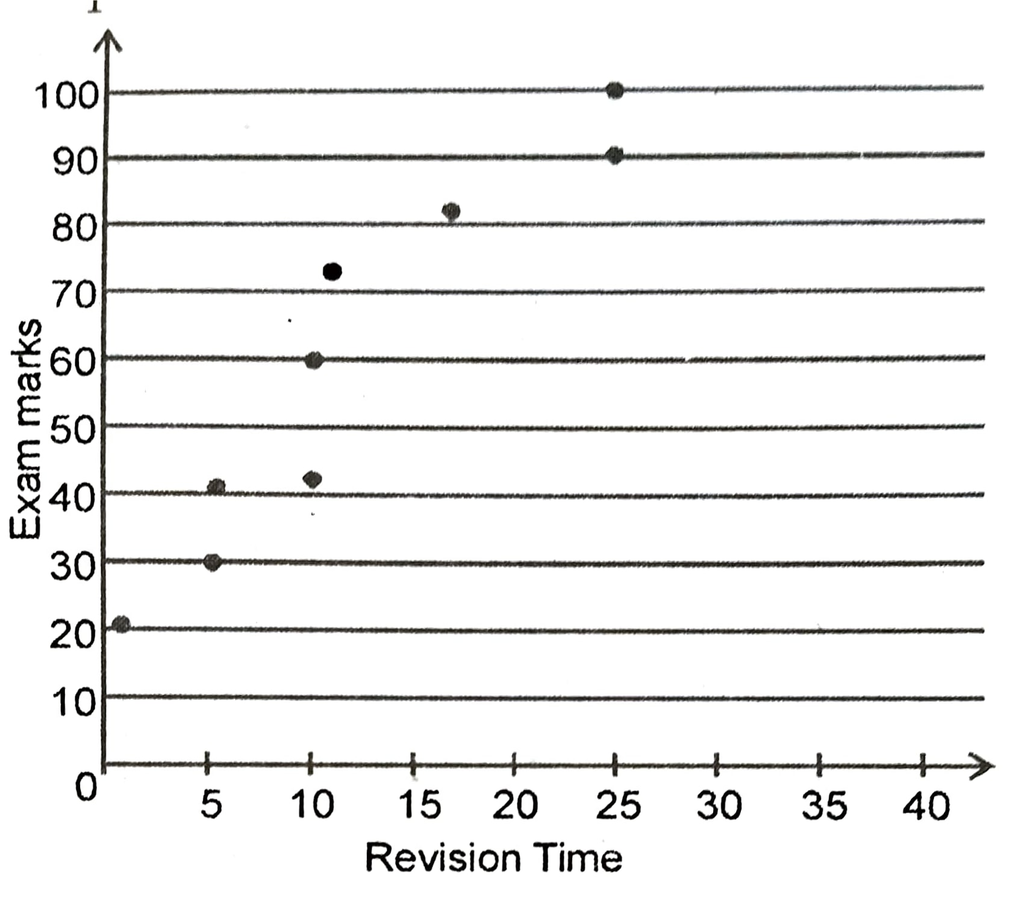
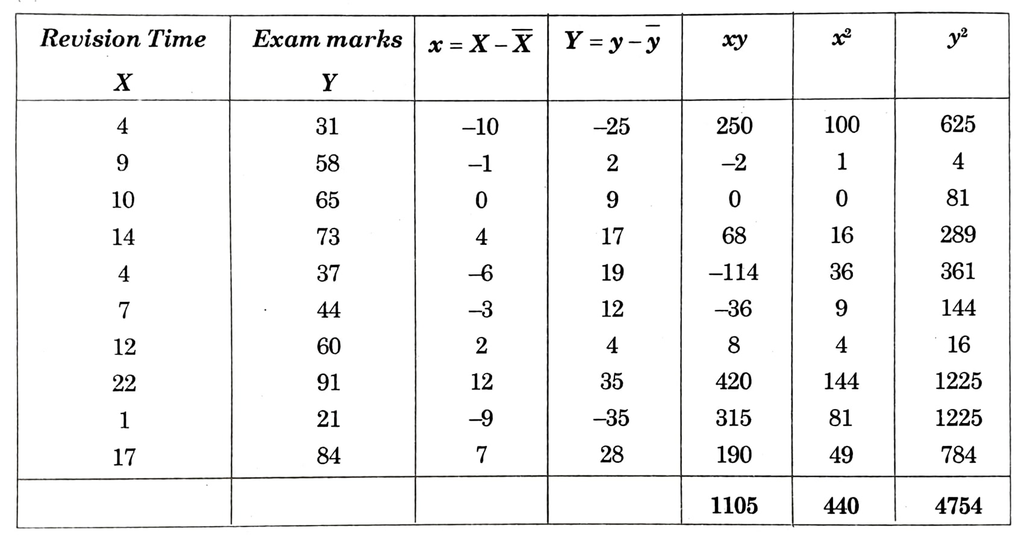
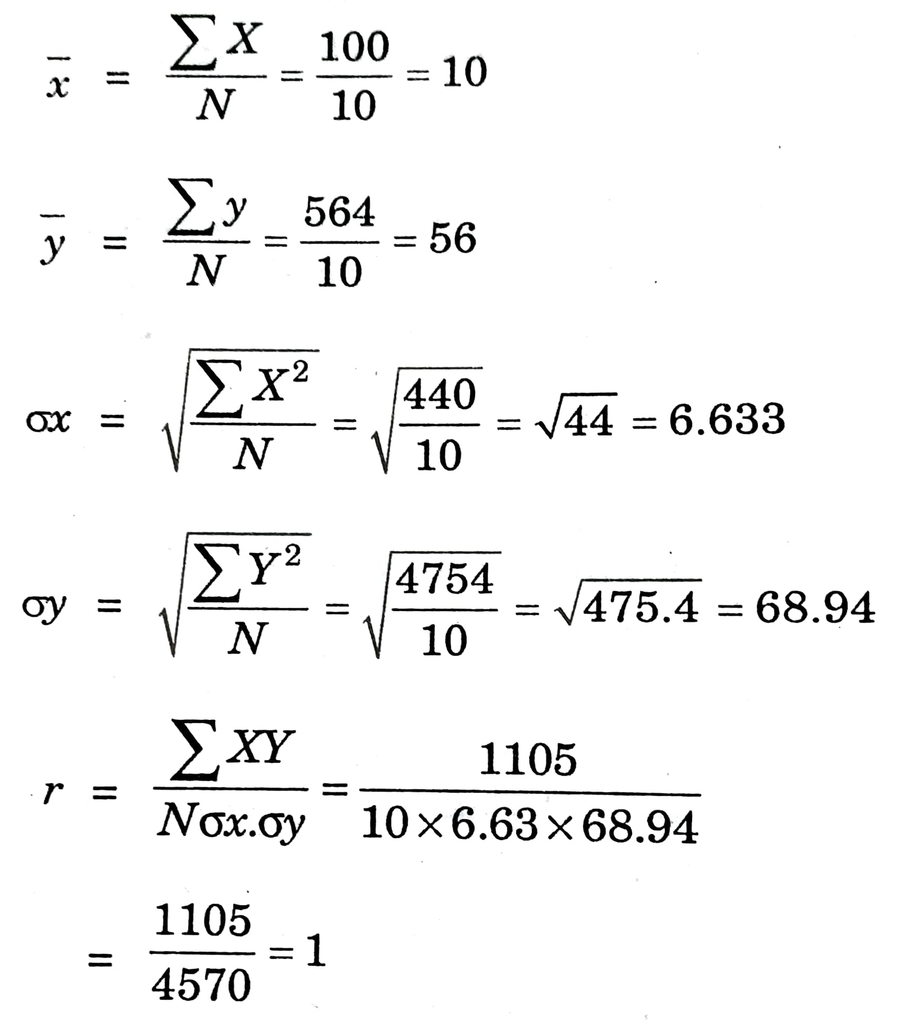
Q.7 A trainee manager wondered whether the length of time his trainees revised for an examination had any effect on the marks they scored in the examination. Before the exam, he asked a random sample of them to honestly estimate how long, to the nearest hour, they had spent revising. After the examination he investigated the relationship between the two variables.

(a) Plot the scatter diagram in order to inspect the data.
(b) Calculate the correlation coefficient.
Ans. (a) Revision time X₁ and Exam mark Y
(b)
Q.8. Positive values of covariance indicate:
(a) A positive variance of the x values.
(b) A positive variance of the y values.
(c) The standard deviation is positive.
(d) Positive relation between two variables.
Ans. (d) positive relation between two variables.
Q.9. A numerical measure of linear association between two variables is the:
(a) Variance.
(b) Coefficient of variation.
(c) Correlation coefficient.
(d) Standard deviation.
Ans. (c) Correlation coefficient.
Q.10. The coefficient of correlation ranges between:
(a) 0 and 1.
(b) -1 and +1.
(c) Minus infinite and plus infinity.
(d) 1 and 100.
Ans. (c) Minus infinite and plus infinity.
Q.11. The coefficient of correlation:
(a) Can be larger than 1.
(b) Cannot be larger than 1.
(c) Cannot be negative.
(d) None of these.
Ans. (a) Can be larger than 1.
Q.12. If height is independent of average yearly income, what is the predicted correlation between these two variables?
(a) 1
(b) -1
(c) 0
(d) Impossible to say for sure.
Ans. (c) 0.
Q.13. A student produces a correlation of + 1.3. This is:
(a) A high positive correlation.
(b) A significant correlation.
(c) An impossible correlation.
(d) Only possible if N is large.
Ans. (a) A high positive correlation.
Q.14. What sort of correlation would be expected between a company’s expenditure on health and safety and the number of work related accidents.
(a) Positive.
(b) Negative.
(c) None.
Ans. (b) Negative.
Q.15. If A scored the top mark in the apprentices test on computing and the correlation between that test and the test on English language was +1.0, what position did A get in the test on English language?
(a) Middle.
(b) Bottom.
(c) Top.
(d) Cannot say from the information given.
Ans. (c) Top.
Q.16. Which correlation is the strongest + 0.65 or – 0.70
(a) -0.70
(b) +0.65
(c) Depends on N.
(d) Cannot say from the information given.
Ans. (b) + 0.65.
Q.17. The symbol for the Karl Pearson Correlation Coefficient is:
(a) Σ
(b) σ
(c) a
(d) r
Ans. (d) r.
Q.18. When “r” is negative, one variable increases in value, _________.
(a) The other increases.
(b) The other increases at a greater rate.
(c) The other variable decreases in value.
(d) There is no change in the other variable.
(e) All of the above.
Ans. (c) The other variable decreases in value.
Q.19. If two variable are absolutely independent of each other the correlation between them must be:
(a) -1
(b) 0
(c) +1
(d) +0.1
Ans. (b) 0.
Q.20. For a normal good, if price increases then the quantity demanded decreases. What type of correlation co-efficient would you expect in this situation?
(a) 0
(b) Positive.
(c) 0.9
(d) Negative.
(e) Unknowable.
Ans. (d) negative.
Conclusion
We hope these NIOS Class 12 Economics Chapter 10 solutions will help you understand the important concepts and methods of correlation analysis. By practising the textbook questions and numerical problems, students can strengthen their understanding of positive and negative correlation, correlation coefficients, covariance, Karl Pearson’s method and Spearman’s rank correlation. Regular practice will help students interpret statistical relationships and solve examination questions with confidence. These NIOS Class 12 Economics Chapter 10 question answers will also make revision easier and help you prepare effectively for your NIOS Class 12 Economics examinations.